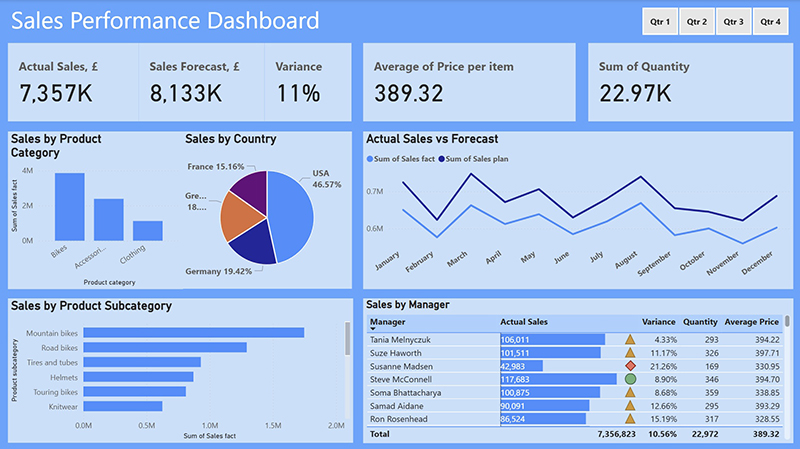
The Practical Power BI & DAX - Level 3 Course will teach you how to turn your data into stunning visuals or dashboards, like the one pictured on the left, with advanced data-analysis tools, AI capabilities, and user-friendly report-creation tools. We will take you step-by-step through the wide range of Power BI visuals, including the familiar bar, column, and pie charts and more sophisticated charts such as treemaps, ribbon and funnel charts, and waterfall charts. The course will also teach you the fundamentals of DAX, allowing you to perform advanced data analysis and create dynamic reports, and you will learn to use DAX functions to enhance your Power BI dashboards and reports. You will begin by exploring the fundamentals of DAX syntax and basic functions. Then you will discover how to create and use calculated columns for data analysis and how to develop simple and not-so-simple measures for dynamic reporting.
Microsoft Power BI is a business intelligence platform that allows users to connect to and visualise data to uncover insights and create interactive reports. It is used to turn data into visuals, help make better decisions, and can be used in conjunction with familiar tools like Microsoft Excel. Data Analysis eXpressions (DAX) is a library of functions and operators that can be combined to build formulas and expressions in Power BI, enabling powerful custom calculations and dynamic aggregations, considerably enhancing data analysis and reporting.
The course teaches all you need to know about the major components of the Power BI application and DAX functions and is presented in a modern multimedia online format, with the constant support and guidance of your designated course tutor, who is there for you every step of the way. During the course, you will build stunning dynamic dashboards, like the one pictured below, combining multiple charts, tables, and KPI indicators that react automatically to filters.
So, for example, you can select a particular year and see the data for that year on all charts. Or you can select a particular region or department and see only data on every chart pertaining to your selection. You will be amazed at what you can achieve with your newly-found skills.
The course is based on the tried and tested learn-by-example methodology, where we provide detailed information on a topic, provide an example, and offer you the opportunity to try it yourself. As you progress through the course, you will complete a series of exercises and assignments that give you the valuable hands-on practice you need to become proficient in Power BI and DAX.
On successful completion of the course, students will receive the Distance Learning Centre Practical Power BI & DAX Diploma with feedback and analysis of your completed work, as well as an Open Awards Level 3 Quality Endorsed Unit Course Certificate.